Intro
Debugging is an important aspect of being a programmer. It can also be very tedious and time consuming and this is why good debug tools are crucial to make the process as quick and pain free as possible. Despite this, it is easy to become lazy and kind of forget that you can improve your own workflows. An example of this is how I myself realised that I rarely use debug rendering when developing games, even though this would often be immensely helpful to for example visualise algorithms and random data here and there which is hard to grasp in numbers. In this post I’ll explain how I improved my debug rendering method.
The problem
So what is the issue with my current debug rendering capabilities? I can easily render primitives and sprites, so using it should be easy right? Well, it turns out that for me the biggest obstacle has been application structure. In an application that separates rendering from logic with layers of abstraction etc, it can be very cumbersome to render things from say an algorithm in the bottom layer. Would you pass a renderer reference all the way down? Set up messaging and send rendering messages all the way up? Even if you ugly hack it temporarily in the quickest way it can be annoying and boilerplatey to setup and get rid of. This made me neglect debug rendering all together pretty much.
Global tools
To solve this, I decided to introduce something that I can use anywhere without passing it around. In other words, a global debug renderer. This solves the problem in the same way as std::cout. No cost to include it, and no cost to remove it. Is this bad practice since “globals are bad”? Whilst global variables are bad in many cases, I don’t believe this is one of them. It is mostly bad when there is global state which is depended upon in many places, because that’s when you cannot trace where changes comes from and the whole application flow risks becoming unclear. In this case, the global debug rendering is output only and nothing will depend on it for further execution. No hidden surprises involved.
How do we implement this? It could be implemented as a typical singleton which constructs and sets itself up as a static variable, however I don’t like that approach since it becomes hard to reason about when/where it is setup. It will still have to be dependent on an OpenGL context being available and such, so in my opinion there is value in being explicit about when it is setup. We can ensure this by providing a function for setting it up whenever appropriate. I followed the same pattern for a render flush function to make sure that everything is rendered at the time I want.
class DRen
{
    public:
        //sets up the debug renderer
        static void initialize(fea::Renderer2D& renderer, const fea::Camera& camera);
        //renders all queued up debug drawables so far
        static void flush();

        //our global instance
        static DRen out;
    private:
        static fea::Renderer2D* mRenderer;
        static fea::Camera mCamera;
};
With this, all you need to do is to call initialize(…) right after your rendering is setup and flush() at the end of your render loop to make sure the debug rendering goes on top of everything else (assuming no z-ordering). My debug renderer uses Feather Kit for rendering but the code should easily translate to other rendering systems as well.
Now we need to define our debug drawables. I’ll just include two in this example but it is easy to define an arbitrary amount. By making them POD structs we don’t have to do much work when writing them and the design will stay simple.
struct DLine //line drawable
{
    glm::vec2 start;
    glm::vec2 end;
    fea::Color color = {255, 255, 255, 200};
};

struct DRect //rectangle drawable
{
    glm::vec2 start;
    glm::vec2 size;
    fea::Color color = {255, 255, 255, 200};
};
These use some maths types from glm and a colour type from Feather Kit but it should be self-explanatory anyway.
To use these with our debug renderer, we need some functions for queueing them up for rendering.
class DRen
{
    //we need to keep track of which debug types have been queued
    enum class DebugType { LINE, RECTANGLE };

    public:
        static void initialize(fea::Renderer2D& renderer, const fea::Camera& camera);
        static void setCamera(const fea::Camera& camera);
        static void flush();
        //overloaded queue for lines
        static void queue(DLine line);
        //overloaded queue for rectangles
        static void queue(DRect rectangle);

        static DRen out;
    private:
        static fea::Renderer2D* mRenderer;
        static fea::Camera mCamera;
        //store a queue of what types of debug primitives have been added in which order
        static std::vector<DebugType> mTypes;
        //all our queued lines in order
        static std::vector<DLine> mLines;
        //all our queued rectangles in order
        static std::vector<DRect> mRectangles;
};
Here I have added firstly an enum DebugType with values for every type of debug drawable. Then I added queue functions for both drawables, as well as queues that store the drawables for flushing later. I also have a third queue which contains the types of drawables that have been queued up. This is to preserve ordering. For example, if I queue two lines, then a rectangle and another line, the mLines will contain the three lines in order, mRectangles will contain a single rectangle and mTypes will contain “LINE, LINE, RECTANGLE, LINE”. This mTypes queue can be iterated when flushing to pick entries from the other queues and render them in the right order as they were queued.
You may have noticed that the global instance of the renderer is called “out”. This is because I out of convenience wanted it to behave just like std::cout. For that we need some operator overloading.
DRen& operator<<(DRen& dren, DLine line)
{
    dren.queue(std::move(line));
    return dren;
}

DRen& operator<<(DRen& dren, DRect rectangle)
{
    dren.queue(std::move(rectangle));
    return dren;
}
With these we can now simply use our renderer like so:
DRen::out << DLine{{0.0f, 0.0f}, {50.0f, 50.0f}, fea::Color::Red}
          << DRect{{50.0f, 50.0f}, {40.0f, 40.0f}, fea::Color::Blue};
We have not looked into how the actual rendering inside the flush() method is implemented, but this is left to the reader to implement since it will be very specific to your rendering system anyway. In principle it is just a matter of extracting the drawables from the queues with help of the type and then create render operations from the data.
Final thoughts
I am so far happy with this way of tackling debug rendering and it has already proven useful to me as it can easily be used even deep down in algorithmic procedures. It is also quite self-contained and unintrusive which is definitely good for debugging too. This basic class can also be extended in ways that fits your projects. For example I added this templated overload of operator«:
template<typename DRenderable>
DRen& operator<<(DRen& dren, std::vector<TTLDRenderable<DRenderable>>& debugs)
{
for(TTLDRenderable<DRenderable>& debug : debugs)
dren << debug;
return dren;
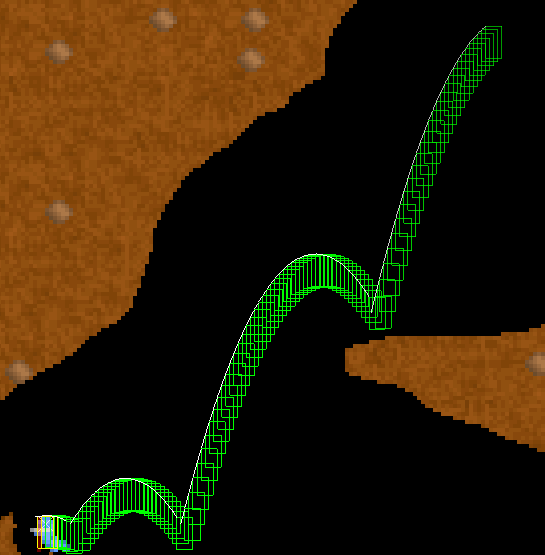
}This lets me pass vectors that contain drawables which is nice if I have gathered lots of debug entries that I then want to render at once. To conclude this article I’ll show you a screenshot as an example on how I used this rendering to visualise my collision routines.
Please let me know if you have any suggestions or feedback on this, and I hope it proved helpful! Thanks for reading.